Solar at 46.6 GW drives massive oversupply, pushing prices to −80 EUR/MWh with 92.6% renewable share.
Back
Generation mix
Wind onshore 14%
Wind offshore 2%
Solar 69%
Biomass 6%
Hydro 2%
Natural gas 3%
Hard coal 1%
Brown coal 4%
93%
Renewable share
10.5 GW
Wind (on + offshore)
46.6 GW
Solar
67.4 GW
Total generation
+20.9 GW
Net export
-80.0 €/MWh
Day-ahead price
14.4°C / 16 km/h
Temp / Wind speed
Open-Meteo, Kassel (51.3°N 9.5°E)
100% / 235.2 W/m²
Cloud cover / Radiation
50
gCO₂/kWh
Records
#2
Export Champion
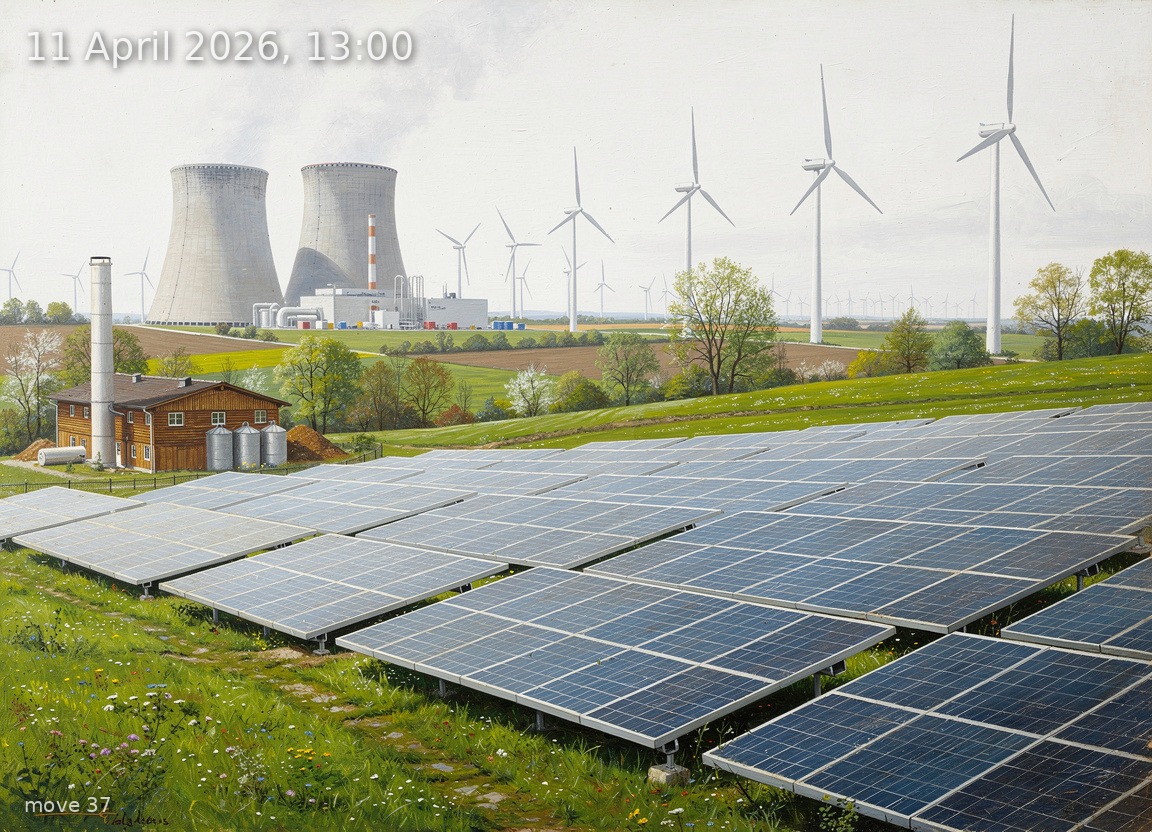
Image prompt
Solar 46.6 GW dominates the entire scene as an enormous expanse of aluminium-framed crystalline silicon PV panels stretching across rolling central German farmland, occupying roughly two-thirds of the composition, their blue-grey surfaces reflecting a bright but fully overcast milky-white sky. Wind onshore 9.3 GW appears as dozens of tall three-blade turbines with white tubular towers and nacelles arrayed along ridgelines in the middle distance, blades turning moderately in a 16 km/h breeze. Wind offshore 1.1 GW is a faint cluster of turbines on the far horizon. Biomass 4.1 GW is rendered as a timber-clad biomass plant with a modest smokestack and woodchip storage silos at the left edge. Brown coal 2.4 GW appears as a pair of hyperbolic concrete cooling towers with thin wisps of steam, positioned in the left background, diminished in scale to reflect their small share. Natural gas 2.1 GW is a compact CCGT plant with a single tall exhaust stack and barely visible heat shimmer beside the cooling towers. Hard coal 0.5 GW is a single small stack nearly lost behind the biomass facility. Hydro 1.3 GW appears as a modest dam and weir visible in a river valley cutting through the middle ground. The lighting is full midday daylight at 13:00 in April — bright, diffuse, shadowless under total cloud cover yet luminous, the sky a uniform pearl-white dome. Spring vegetation: fresh bright-green grass, budding deciduous trees, scattered wildflowers in meadow strips between panel rows. The deeply negative electricity price is conveyed through a vast, open, calm, almost serene atmosphere — no oppression, abundant space, a sense of overflowing plenty. Highly detailed oil painting in the tradition of 19th-century German Romantic landscape painters — Caspar David Friedrich's atmospheric depth meets industrial realism — rich saturated colour, visible confident brushwork, meticulous engineering accuracy on every turbine nacelle, every PV cell grid line, every rivet on the cooling towers. No text, no labels.