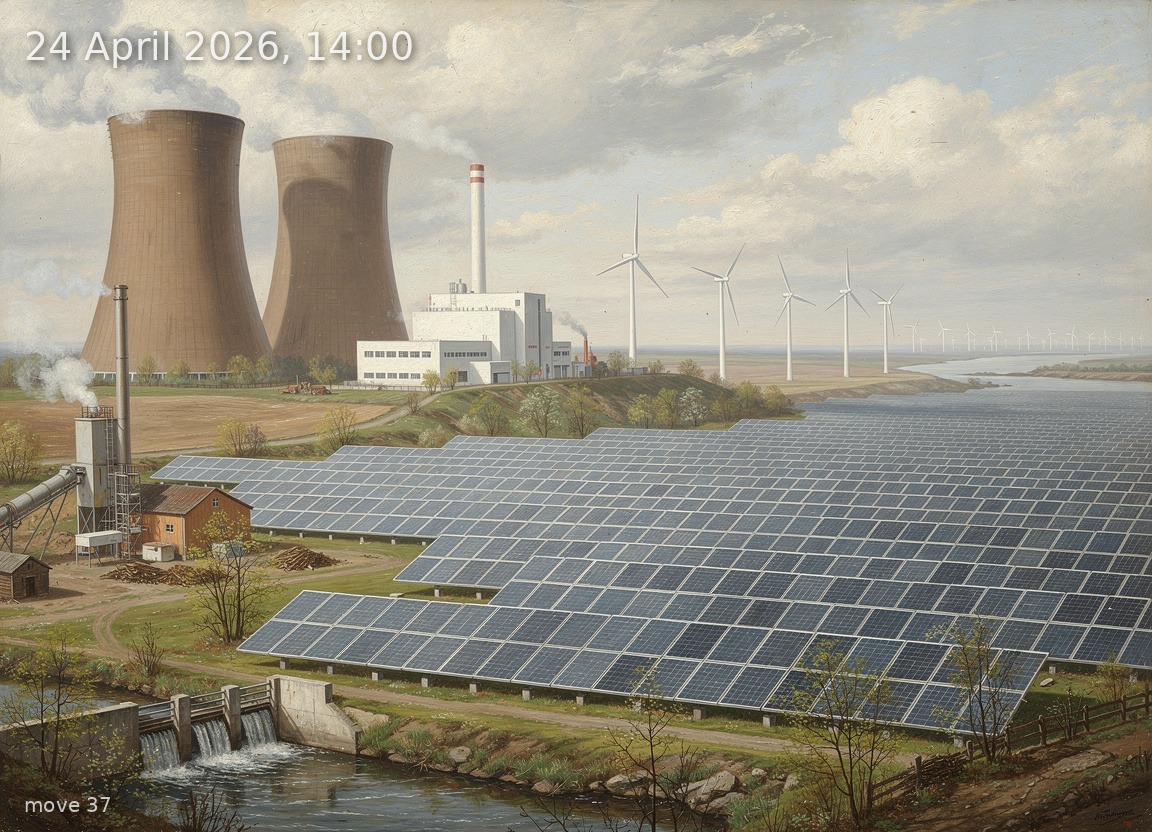
Solar at 44.4 GW drives 11 GW net export and negative prices on an overcast but bright spring afternoon.
Back
Generation mix
Wind onshore 10%
Wind offshore 3%
Solar 69%
Biomass 6%
Hydro 2%
Natural gas 3%
Hard coal 2%
Brown coal 4%
91%
Renewable share
8.6 GW
Wind (on + offshore)
44.4 GW
Solar
64.3 GW
Total generation
+11.0 GW
Net export
-30.0 €/MWh
Day-ahead price
10.4°C / 9 km/h
Temp / Wind speed
Open-Meteo, Kassel (51.3°N 9.5°E)
91% / 284.0 W/m²
Cloud cover / Radiation
66
gCO₂/kWh
Image prompt
Solar 44.4 GW dominates the scene as a vast plain of crystalline silicon PV panels stretching across the entire right two-thirds and centre of the composition, their aluminium frames glinting under diffuse midday light filtering through a thick, layered overcast sky; wind onshore 6.7 GW appears as a line of modern three-blade turbines on a low ridge in the middle distance, rotors turning slowly in light wind, plus wind offshore 1.9 GW suggested by smaller turbines on a hazy far horizon; biomass 4.1 GW is rendered as a modest wood-chip power plant with a tall stack and small steam plume at the left edge; brown coal 2.8 GW occupies the far left as two hyperbolic cooling towers releasing thin wisps of condensation; natural gas 2.0 GW sits as a compact CCGT facility with a single exhaust stack beside the cooling towers; hard coal 1.3 GW is a smaller conventional stack-and-boiler plant barely visible behind the brown coal towers; hydro 1.2 GW appears as a small concrete dam with a narrow river in the lower-left foreground. The sky is bright but entirely overcast at 91% cloud cover, pale grey-white with subtle warm undertones—full April daylight at 14:00 with no direct sun disk visible, yet strong ambient illumination. The landscape is early spring in central Germany: fresh pale-green grass, budding deciduous trees, patches of bare brown earth, temperature around 10 °C giving a cool crispness to the air. The atmosphere is calm and open, reflecting the deeply negative electricity price—no oppressive haze, just serene luminous overcast. Painted in the style of a highly detailed 19th-century German Romantic oil painting—rich, layered colour, visible confident brushwork, atmospheric depth receding into a misty horizon—yet every turbine nacelle, every PV cell grid pattern, every cooling tower's parabolic curve is rendered with meticulous engineering accuracy. No text, no labels.